
Okay, so maybe this will actually be the Complete-ish guide to Core Web Vitals in the end. But I want to take this post and explain what Google’s Core Web Vitals are. Not only that, but how they actually affect your website and what commonly affects these vitals (both positively and negatively). Lastly, we’re going to see how Google is potentially changing one of these soon.
I am writing this guide for both the new and experienced alike. My hope is that this will provide those new to web development or SEO a comprehensive understanding of these metrics. And for those more experienced, my hope is this will serve as a solid reference guide. And, perhaps I’ll be able to provide useful insights beyond just the definition of the metrics!
It’s important to note that Google’s Core Web Vitals look at very specific elements of a website’s performance. I do believe they do a good job painting a picture of your web site’s performance. In this guide, though, I’m going to also introduce a handful of other metrics. These metrics are more or less under the hood of these core vitals. However, I think it’s important to understand them as well. You’ll see them referenced throughout your career in web development or SEO, after all.
First Off, What Are Core Web Vitals?
Google defines a handful of metrics (three, to be exact) to be, unsurprisingly, core to the performance of a web site. These metrics define how quickly a website displays, becomes usable, its overall load speed, and what happens after it has loaded. Understanding these metrics is extremely useful from both a technical standpoint, but also for SEO.
A central element to SEO is the overarching necessity to provide a good user experience. Google wants to shuttle its user to websites that are enjoyable to use. As such, it’s very important to know what these metrics are, and how Google is looking at them. For the web developers out there- you need to care about this too, as these efforts start with you!
While Google only defines three metrics for its Core Web Vitals, we’re looking at (as the title of this post indicates) more than just that. Beyond just the core metrics, we’re also looking at other performance metrics tracked by Google via its Lighthouse tool!
Locating These Metrics
Before we get too much further, let’s look at how we can pull up a website’s Core Web Vitals. After all, this guide doesn’t matter much if you don’t know how to find this data for your own website!
Search Console
If your website is existing, and you’ve had Search Console linked up, that’s the first place I’d recommend you look. Under Search Console > Experience you’ll find “Core Web Vitals” listed. Sign in to your account and viola.
You may find there’s no data available in Search Console. That’s indicative of your website not having sufficient data. This is a consequence of time or traffic. But that’s okay because we have two additional ways to pull the report on the fly!
Lighthouse via PageSpeed Insights or Chrome
PageSpeed Insights is Google’s tool for generating performance reports online. If you aren’t familiar with this tool yet, I’d recommend digging into it. This is your way of looking at everything Google analyzes. PageSpeed Insights also mimics a slower, mobile connection to your website. As of writing this post (I’m not sure that it changes, though), it was emulating a Moto G4 with 4x CPU throttling and “slow 4G” (to the tune of 1.6Mbps). I believe this is a fixed value, and thus cannot change via InSights. You can, however, change that via our final tool for generating this report…
Lighthouse via Chrome! In your Chrome browser bring up your developer tools (F12, Ctrl+Shift+I, or Menu > More Tools > Developer Tools at the bottom). You’ll then want to click on Lighthouse in the developer tools menu (pictured below).
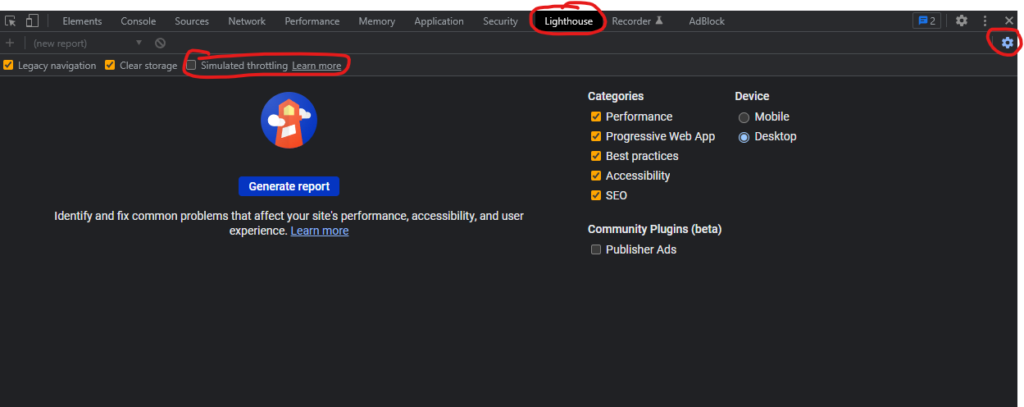
I’ve crudely marked up this screenshot to show you a couple things. First is showing you where the Lighthouse tool is listed in the dock. And the second marking shows you the simulated throttling option, and the fact you can enable or disable it. If you don’t see that option, click the settings icon I highlighted off to the right. That’ll bring it up for you. Feel free to run your rests both throttled and not. As far as what matters for SEO, though, throttled is where it’s at.
Side Note:
I believe, in the past, you were able to actually define example networks in Lighthouse. This was useful if you wanted to see your page load on a genuinely awful connection. You can still accomplish this with the Lighthouse app via your desktop, but not Chrome. This is on my list of things to write about soon. So if digging deeper into Lighthouse interests you, and even automating it, comment below. And check back here soon- I’m working on it!
Defining the Core Web Vitals
Alright, at this point we’re able to either locate our data via Search Console, or pull a report on the fly via PageSpeed Insights or Lighthouse. How you pull this data, or generate it, is entirely up to you. But I would remember that Search Console is Google’s single source of truth. Use Search Console wherever possible.
The three metrics defined by Google as their “Core Web Vitals” are: LCP (Largest Contentful Paint), FID (First Input Delay), and CLS (Cumulative Layout Shift).
Largest Contentful Paint
Largest Contentful Paint (LCP) is a measurement of time, in seconds, for how long the largest content element takes to render. LCP is a favored metric by Google as it’s more in line with how the user perceives the page load. It may be easy to assume that LCP is watching for the loading of the largest text block. But it’s also watching for <img>, <image>, and <video> elements. So, if an image is your largest element (versus a text block, for example), it’ll count the load time of that image.
Please note that LCP is not looking at size as a measurement of storage (i.e. MB or KB). But rather screen real-estate. And CSS does not impact that calculation- so giving a DIV obscene amounts of padding or margin won’t make it the largest element for the LCP calculation, even if it is the largest, visually, to the user.
LCP is ranked by Google via the following rubric:
| Largest Contentful Paint in Seconds | Ranking (color-coded) |
| 0 – 2.5 seconds | Fast (green) |
| 2.5 – 4.0 seconds | Moderate (orange) |
| 4.0+ seconds | Slow (red) |
Improving your LCP time is going to largely come down to server response and resource management. Optimizing images so that they aren’t massive, slow to load beasts, for example, is very important for LCP. Minimizing TBT by reducing render-blocking elements is also imperative for LCP time. We discussed font display earlier, too. And that, also, is an important factor for LCP. In short- most everything we’ve discussed so far will impact your LCP time.
Interestingly, LCP is the newest (though it’s still been in use in Lighthouse for over 2 years) of these metrics. It’s also the one with the most nuances because of how it needs to determine which element it’s grading, what can and cannot influence that, etc. Google has a good article written up as a deep dive into LCP that I’d recommend you check out if you want to know more than what I’ve summarized here.
First Input Delay
First Input Delay (FID) is a measurement of time, in milliseconds, for how long the browser takes to respond to user interactivity. That is, once the user does something, like clicking a button, how long is it until the browser is able to fire the event handler(s). It’s worth nothing that FID isn’t measuring how long the event takes to complete. But rather it’s a measurement of input delay.
FID is ranked by Google via the following rubric:
| First Input Delay in Milliseconds | Ranking (color-coded) |
| 0 – 100 milliseconds | Good (green) |
| 100 – 300 milliseconds | Needs Improvement (orange) |
| 300+ milliseconds | Poor (red) |
Improving FID will require a granular analysis of your JavaScript efficiency. A good place to start is by identifying the most expensive operations you’re performing in terms of DOM interactivity. And from there, either reducing the cost by increasing specificity (rather than querying for all DIVs, query for DIVs with a specific class, or DIVs where the first child is a paragraph, etc.) or ensuring you’re not repeating the operation needlessly.
What you’re aiming for is a reducing in the workload of the browser’s main thread. The less time the main thread remains locked in operation, the more responsive it can be in handling user interactivity.
We’re going to discuss other strategies later in this post (especially when discussing Total Blocking Time) and Time to Interactive. Ideas raised there are applicable here as well!
Cumulative Layout Shift
Unlike the other metrics we’ll discuss here, Cumulative Layout Shift (CLS) is not a measurement of time. But rather it’s a formulaic calculation of movement on the screen. CLS takes into account how much of the screen the element uses, both when it’s first shown and after it moves, and how far it has moved, to determine a score. The higher the score, the worse the movement.
Sometimes the layout needs to shift (i.e. a hamburger menu sliding out), and doing so is intentional and wanted. It would be counterintuitive to count these in the CLS metric. To combat that, CLS excludes movement that occurs within 500 milliseconds of a user interaction. So there’s no need to worry that your navigation menu is going to get you into hot water with Google!
CLS is ranked by Google via the following rubric:
| Cumulative Layout Shift Score | Ranking (color-coded) |
| 0 – 0.1 | Good (green) |
| 0.1 – 0.25 | Needs Improvement (orange) |
| 0.25+ | Poor (red) |
CLS issues boil down to either bugs or not following best practices. A good first step is identifying what elements are moving, and then replicating that concern. Is it happening as the result of a resizing of another element, for example? Is the introduction of an element earlier in the document causing later elements to go haywire?
Google has a couple articles worth reading regarding CLS:
- Optimize CLS goes best practices on how to avoid layout shfits.
- Debug layout shifts takes a deeper dive into finding these issues.
Beyond the Core Web Vitals
As mentioned previously, you’re going to find LCP, FID, and CLS data not just in PageSpeed Insights and Lighthouse, but also in your Search Console. The metrics we’re about to discuss are, in my opinion, very important to understanding your website’s performance, though.
So fire up Lighthouse or PageSpeed Insights, generate the report for your website, and let’s get analyzing the results!
First Contentful Paint
First Contentful Paint (FCP) is a measurement of time, in seconds, for how long the browser takes to render the first DOM element. In other words, this is how long the user waits until they begin to see content on your page. Blank elements, such as an empty, white <canvas>, will not count. However, all images, even a 1×1 transparent GIF or a plain white JPG, will count.
FCP is ranked by Google via the following rubric:
| First Contentful Paint in Seconds | Ranking (color-coded) |
| 0 – 1.8 seconds | Fast (green) |
| 1.8 – 3.0 seconds | Moderate (orange) |
| 3.0+ seconds | Slow (red) |
Often times FCP is a result of bottle necking in caching or your server’s response capabilities. If you’re not caching at all, that can, and will, have an immediate impact on FCP. Render-blocking elements, which we’ll discuss in the Total Blocking Time metric as well, also directly impact FCP.
A less common problem, but one to be cognizant of, is your DOM size can impede your FCP time. I say this is less common because efficient serving of your DOM will offset the impact of the DOM size. But, if you feel this may be a bottleneck, you may want to look at how much you’re serving up on page load. Perhaps a progressive loading strategy may be beneficial for you. Or, implementing pagination if you haven’t can also help.
Time to Interactive
Time to Interactive (TTI) takes FCP a little further, and measures in time (seconds) how long it takes for your website to become interactive. That is, how long until your website responds to user feedback. From the user’s standpoint, this is the time until they can begin clicking on components with the website responding the way it should. Think: how long until the user can click the hamburger menu and it’ll actually toggle.
At a technical level, this means TTI is a measurement for how long it takes the browser to register all event handlers. After all, what good are all of these onClick, onMouseover, etc. events if the browser hasn’t registered them.
TTI is ranked by Google via the following rubric:
| Time to Interactive in Seconds | Ranking (color-coded) |
| 0 – 3.8 seconds | Fast (green) |
| 3.9 – 7.3 seconds | Moderate (orange) |
| 7.3+ seconds | Slow (red) |
Improving TTI is almost entirely in your JavaScript. Efficient delivery of your scripting is critical, and is the first place I’d start. Minify your scripts, and reduce how many scripts you’re loading in the first place. It’s also a good idea to minify your CSS, too, while you’re at it. Though that isn’t so significant in this section.
A common offender for TTI is the use of third-party scripts and frameworks. Reducing how many of these exist is a good place to start. You should also ensure these scripts are located on your server or being on a responsive CDN.
From there you should optimize your application. First, remove any unused JavaScript. Second, cache your scripts. Also, improve load times by identifying what is mission critical. You can then split your less important code off on its own, and defer its loading.
Speed Index
Speed Index is a measurement, in seconds, for how long it takes the browser to visually display content. To measure this, Lighthouse records the loading of your website and then analyzes the frames. By doing so, it can compare frame over frame how long your website takes to visually load. Unlike FCP, Speed Index is measuring a complete load, and not just the first piece of content.
Speed Index is ranked by Google via the following rubric:
| Speed Index in Seconds | Ranking (color-coded) |
| 0 – 3.4 seconds | Fast (green) |
| 3.4 – 5.8 seconds | Moderate (orange) |
| 5.8+ seconds | Slow (red) |
Like TTI, JavaScript can be a major factor in your Speed Index time. Improving your TTI will likely have a positive impact on your Speed Index (and vice versa).
Google recognizes a major factor in modern websites, though, is the loading of fonts. With how prevalent custom fonts are today, it’s no wonder that there’s a performance implication. Google outlines a number of strategies to efficiently handle font display.
Total Blocking Time
Total Blocking Time (TBT) is a measurement of time, in milliseconds, of how long your website remains blocked until TTI. To be more specific, TBT watches for what it considers long tasks (anything that takes longer than 50ms to complete), and adds the time taken by all of those tasks (minus the first 50ms). The window in which it’s recording is between FCP and TTI.
What I like about this metric is that it takes into account the necessity for render-blocking actions. Loading scripts, for example, is a necessity. There’s just no getting around that. By “forgiving” the first 50ms, it measures detrimental blocking rather than all blocking.
TTB is ranked by Google via the following rubric:
| Total Blocking Time in Milliseconds | Ranking (color-coded) |
| 0 – 200 milliseconds | Fast (green) |
| 200 – 600 milliseconds | Moderate (orange) |
| 600+ milliseconds | Slow (red) |
Improving TBT is critical for TTI and Speed Index. Like TTI and Speed Index, fortunately, it’s almost exclusively a byproduct of JavaScript. And because of that, your efforts for the other metrics may help your TBT time.
TBT, though, is a little more granular. Optimizing your code is significantly more impactful to TBT than the other metrics. A more specific example of this is how you query the DOM. Rather than querying all DIV elements, for example, increase specificity. And, where possible, don’t repeat those same queries.
It All Comes Together In the End
All of these metrics, taken on their own, mean little to nothing. It’s important to take every bit of data we have to interpret the bigger picture. My hope is that this post will act as a decent summary for these metrics. And if you walk away today having picked up on a couple ideas for where to improve, awesome!